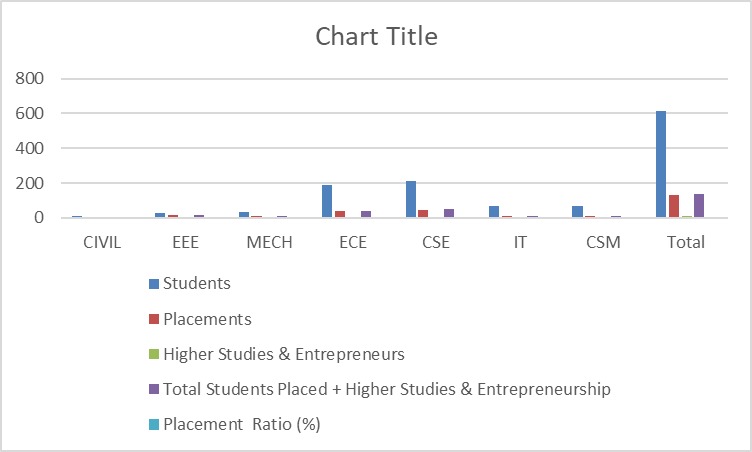
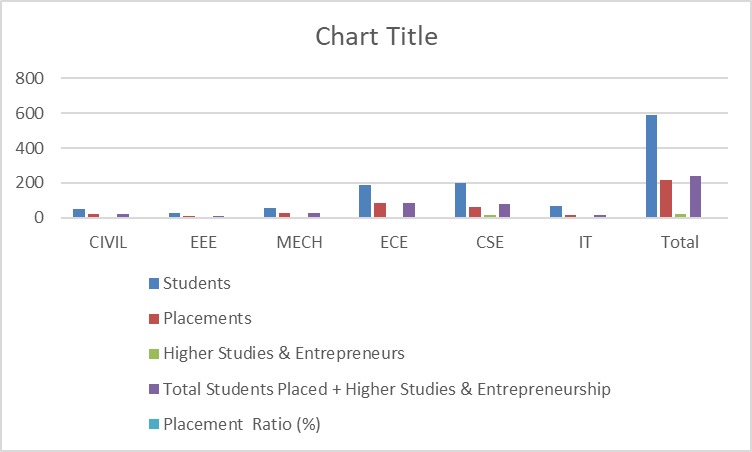
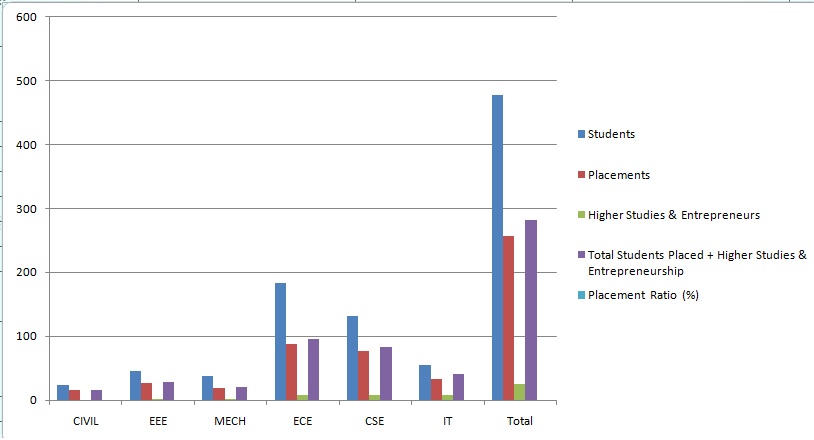
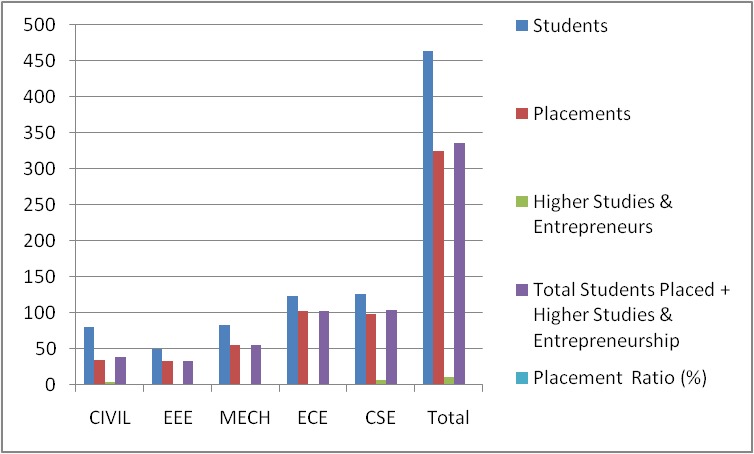
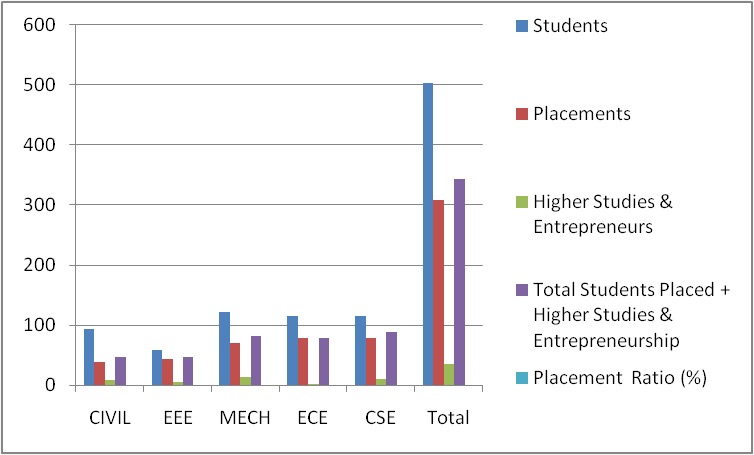
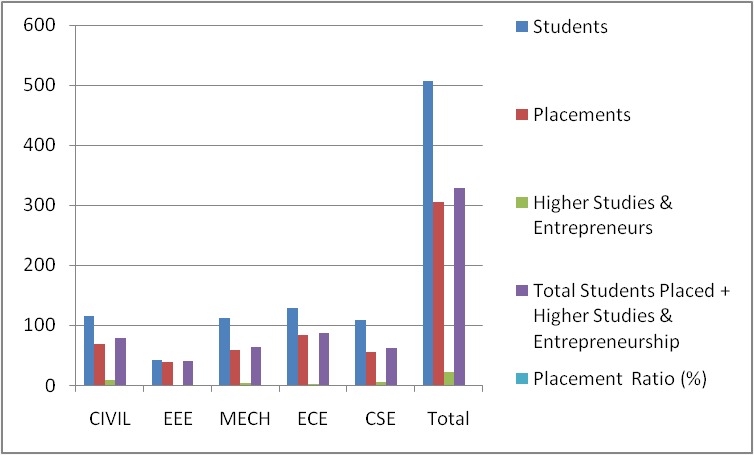
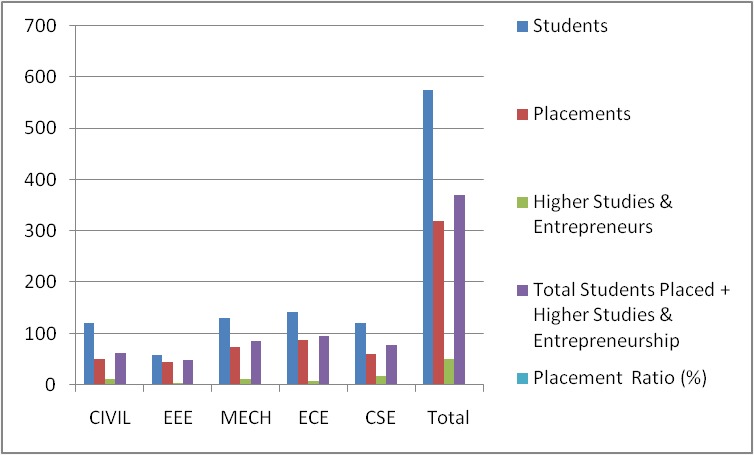
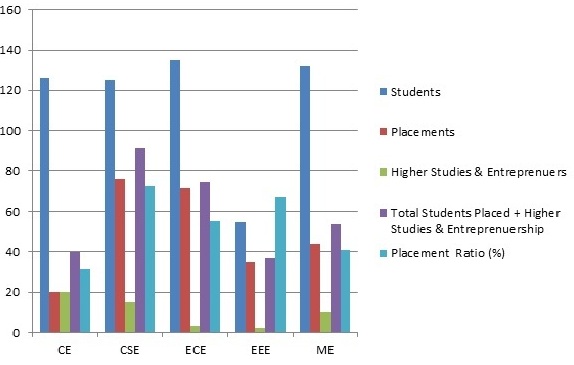
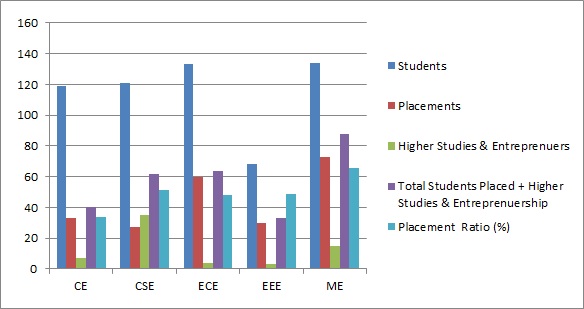
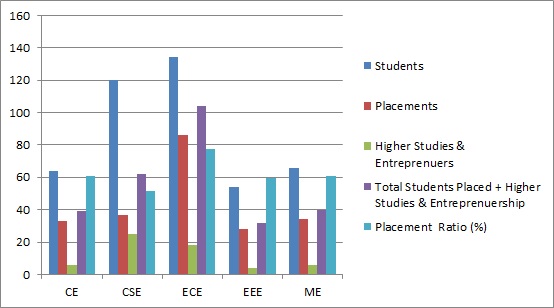
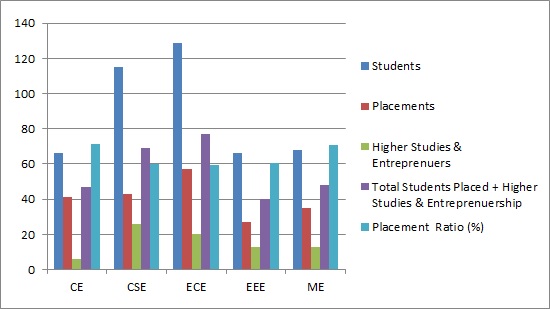
Placement Statistics Department wise Placement Statistics Academic Year : 2024-25 * Still Counting SNO CIVIL EEE MECH ECE CSE IT CSM Total 1 Students 12 29 36 189 211 70 66 601 2 Placements 0 18 12 37 44 9 9 129 3 Higher Studies & Entrepreneurs 1 0 0 1 7 1 1 11 4 Total Students Placed + Higher Studies & Entrepreneurship 1 18 12 38 51 10 10 140 5 Placement Ratio (%) 8.33% 62.07% 33.33% 20.11% 24.17% 14.29% 15.15% 23.29% Academic Year : 2023-24 SNO CIVIL EEE MECH ECE CSE IT Total 1 Students 50 25 53 189 201 69 587 2 Placements 21 11 25 85 60 16 218 3 Higher Studies & Entrepreneurs 0 1 0 1 17 2 21 4 Total Students Placed + Higher Studies & Entrepreneurship 21 12 25 86 77 18 239 5 Placement Ratio (%) 42.00% 48.00% 47.17% 45.50% 38.31% 26.09% 40.72% Average Package: 3.26 LPA Academic Year : 2022-23 S.No CIVIL EEE MECH ECE CSE IT Total 1 Students 24 46 37 184 132 55 478 2 Placements 15 27 19 87 76 33 257 3 Higher Studies & Entrepreneurs 0 1 1 8 7 8 25 4 Total Students Placed + Higher Studies & Entrepreneurship 15 28 20 95 83 41 282 5 Placement Ratio (%) 62.50% 60.87% 54.05% 51.63% 62.88% 74.55% 59.00% Average Package: 3.11 LPA Academic Year : 2021-22 Sno CIVIL EEE MECH ECE CSE Total 1 Students 80 50 84 124 126 464 2 Placements 35 34 55 103 98 325 3 Higher Studies & Entrepreneurs 4 0 1 0 6 11 4 Total Students Placed + Higher Studies & Entrepreneurship 39 34 56 103 104 336 5 Placement Ratio (%) 48.75% 68.00% 66.67% 83.06% 82.54% 72.41% Average Package: 3.23 LPA Academic Year : 2020-21 Sno CIVIL EEE MECH ECE CSE Total 1 Students 94 58 121 115 115 503 2 Placements 39 43 70 78 78 308 3 Higher Studies & Entrepreneurs 8 4 12 1 10 35 4 Total Students Placed + Higher Studies & Entrepreneurship 47 47 82 79 88 343 5 Placement Ratio (%) 50.00% 81.03% 67.77% 68.70% 76.52% 68.19% Average Package: 2.72 LPA Academic Year : 2019-20 Sno CIVIL EEE MECH ECE CSE Total 1 Students 115 42 112 128 109 506 2 Placements 69 39 59 83 55 305 3 Higher Studies & Entrepreneurs 9 1 4 3 6 23 4 Total Students Placed + Higher Studies & Entrepreneurship 78 40 63 86 61 328 5 Placement Ratio (%) 67.83% 95.24% 56.25% 67.19% 55.96% 64.82% Average Package: 2.50 LPA Academic Year : 2018-19 Sno CIVIL EEE MECH ECE CSE Total 1 Students 121 59 131 141 121 573 2 Placements 51 45 74 88 61 319 3 Higher Studies & Entrepreneurs 12 3 11 7 17 50 4 Total Students Placed + Higher Studies & Entrepreneurship 63 48 85 95 78 369 5 Placement Ratio (%) 52.07% 81.36% 64.89% 67.38% 64.46% 64.40% Average Package: 2.54 LPA Academic Year : 2017-18 S.No Branch CE CSE ECE EEE ME Total 1 Students 126 125 135 55 132 573 2 Placements 20 76 72 35 44 247 3 Higher Studies & Entrepreneurs 20 15 3 2 10 50 4 Total Students Placed + Higher Studies & Entrepreneurship 40 91 75 37 54 297 5 Placement Ratio (%) 31,74 72.8 55.5 67.27 40.9 51.83 Academic Year : 2016-17 S.No Branch CE CSE ECE EEE ME Total 1 Students 119 121 133 68 134 575 2 Placements 33 27 60 30 73 223 3 Higher Studies & Entrepreneurs 7 35 4 3 15 64 4 Total Students Placed + Higher Studies & Entrepreneurship 40 62 64 33 88 287 5 Placement Ratio (%) 33.61 51.24 48.12 48.53 65.67 49.91 Academic Year : 2015-16 S.No Branch CE CSE ECE EEE ME Total 1 Students 64 120 134 54 66 438 2 Placements 33 37 86 28 34 218 3 Higher Studies & Entrepreneurs 6 25 18 4 6 59 4 Total Students Placed + Higher Studies & Entrepreneurship 39 62 104 32 40 277 5 Placement Ratio (%) 60.94 51.67 77.61 59.26 60.61 63.24 Academic Year : 2014-15 S.No Branch CE CSE ECE EEE ME Total 1 Students 66 115 129 66 68 444 2 Placements 41 43 57 27 35 203 3 Higher Studies & Entrepreneurs 6 26 20 13 13 78 4 Total Students Placed + Higher Studies & Entrepreneurship 47 69 77 40 48 281 5 Placement Ratio (%) 71.21 60 59.69 60.61 70.59 63.29